
Understanding stocks
Fair Value: two stock valuation methods
What might a stock be worth? SmartDeer looks at fair value from two perspectives: future cash flows and historical valuation multiples.
The Discounted Cash Flow Analysis
The discounted cash flow analysis is a widely recognized method for determining the fair value of a stock. In this process, the forecasted future cash flows or earnings of the company are discounted back to today using a fixed interest rate (i.e., “discounted”).
1. Estimation of the Cash Flow
In the first step, an earnings estimate or a forecast of the free cash flow (FCF) for the next 5–10 years is made. The following graphic shows the expected revenue and earnings development of Apple Inc. for the next five years:
Forecast of Apple Inc.'s revenue and earnings development for the next 5 years
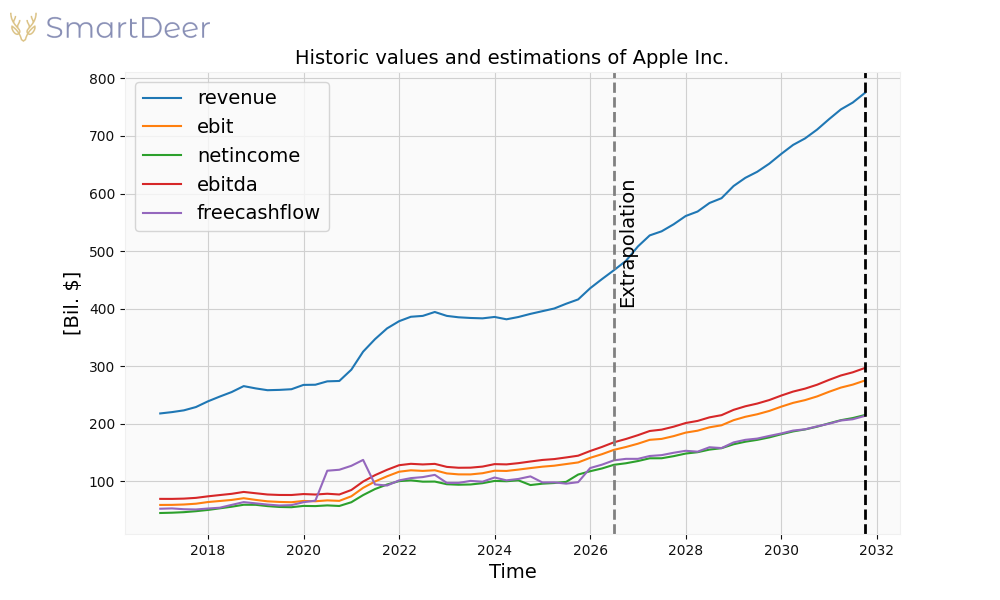
The annual earnings or free cash flows estimated in the forecast for the next five years are then discounted back to today using a specified discount rate r. The rate r represents the expected return that investors anticipate from the investment. It generally depends on the current risk-free rate (e.g., the yield on US Treasury bonds) and a risk premium for the respective stock.
The present value of the future cash flows for years 1 through 5 is given by the following formula:

2. Determination of the Terminal Value
In the second step, the terminal value of the company is determined. It is assumed that after the forecast period, the cash flows will grow only at the average global inflation rate g (assumed to be 3% here). Using the perpetuity formula and the discount rate r, the discounted terminal value is given by the following equation:
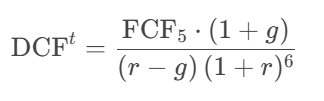
3. The Fair Value
In the final step, the company’s net debt is subtracted from the total value, and the result is divided by the number of outstanding shares n. Net debt consists of short-term liabilities (CL) and long-term liabilities (NL) minus short-term assets (CA).
The overall formula for calculating the "Fair Value" (FV) per share is thus:

In the Fair Value section, the discount rate r is set to 8% and the number of forecast years is set to 5 by default. This is a rather conservative approach, as it assumes that the company will grow very slowly after the forecast period. The default values can be changed using the gear icon ⚙.
The following graphics show the course of Apple’s stock price as well as the historical trend of its “fair” value. As can be seen, the fair value of a stock is highly dependent on the investment horizon and the desired return of the investors.
Forecast period of 5 years with an 8% discount rate

Forecast period of 5 years with a 6% discount rate

4. Limitations
Although the discounted cash flow analysis is a widely used method employed by many analysts, it has some limitations. It works best for companies with moderate growth rates and regular, stable free cash flows or earnings. For companies with very high growth rates, banks, or companies that are not yet profitable, the discounted cash flow analysis should not be applied.
The Multiple-Based Valuation
The multiple-based approach estimates a stock’s fair value by applying the company’s historical trading multiples to its forward fundamentals and then consolidating the resulting valuations into a single fair-value path over time.
1. Selecting Multiples and Forecast Inputs
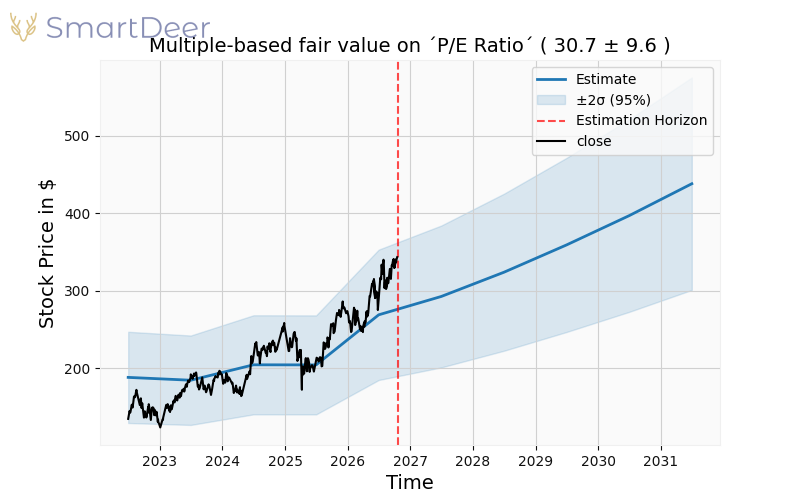
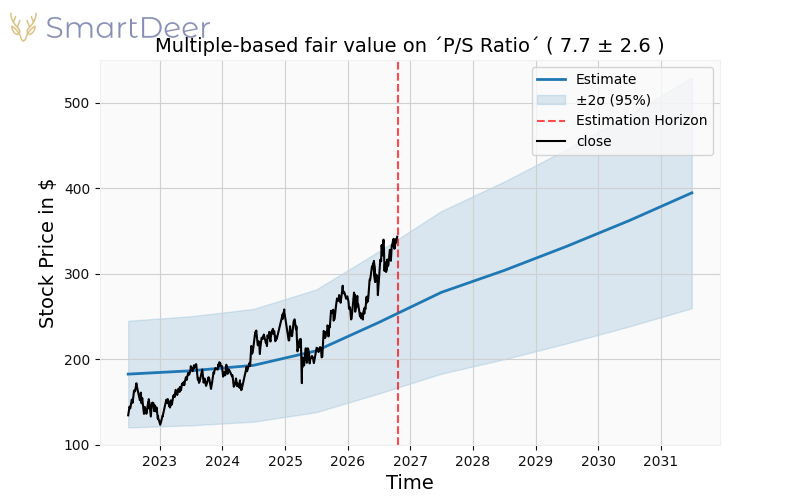
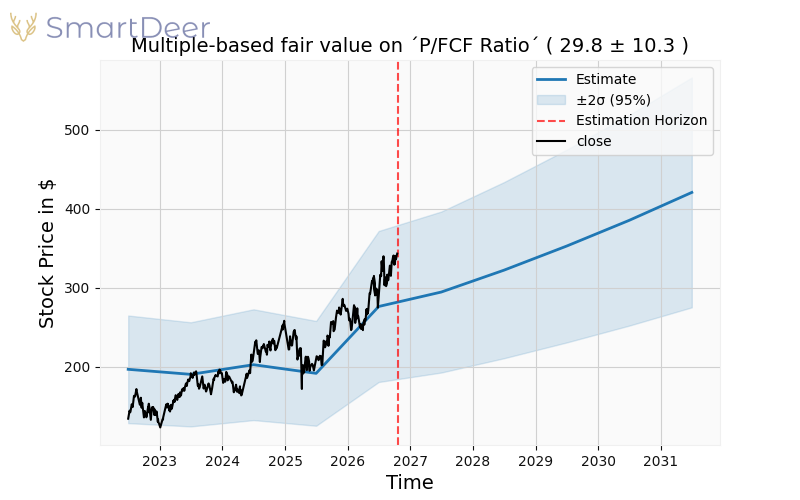
We use the company’s five-year median trading multiples—P/E (price-to-earnings), P/S (price-to-sales), and P/FCF (price-to-free-cash-flow)—as “anchors.” These are paired with forward estimates for earnings, revenue, and free cash flow over the next years.
The charts below illustrate the multiple-based valuation paths for Apple Inc. using each driver in isolation:
2. Applying Multiples to Forecasts
For each forecast period (t), a point estimate of equity value is derived by multiplying the relevant forward metric by its corresponding five-year median multiple. Conceptually:



Dividing by the number of shares outstanding yields a per-share estimate for each method.
3. From Three Lenses to One Fair-Value Series
The three per-share estimates (P/E-based, P/S-based, P/FCF-based) are combined into a single, time-indexed fair-value series. This consolidated path reflects the core signal shared across earnings, revenue, and cash-flow perspectives while smoothing idiosyncrasies in any single ratio.
4. Interpretation and Use
Multiple-based valuation is intuitive, quick to update, and grounded in how the market has historically priced the business. It’s particularly handy when forward fundamentals are reasonably forecastable and the company’s business mix is stable. In practice, analysts often view the P/E, P/S, and P/FCF paths side-by-side and track the consolidated series as the working estimate of fair value through time.
5. Limitations (Read Before You Generalize)
Multiples are sensitive to cycles and regime shifts; accounting quirks can skew ratios; small errors in margins or FCF can compound into large valuation gaps; leverage, dilution/buybacks, and sector specifics are underweighted; and the approach breaks when earnings or FCF turn negative.